In the RRT, a wizard takes the user through these steps and new tools and interfaces have been developed to support this.
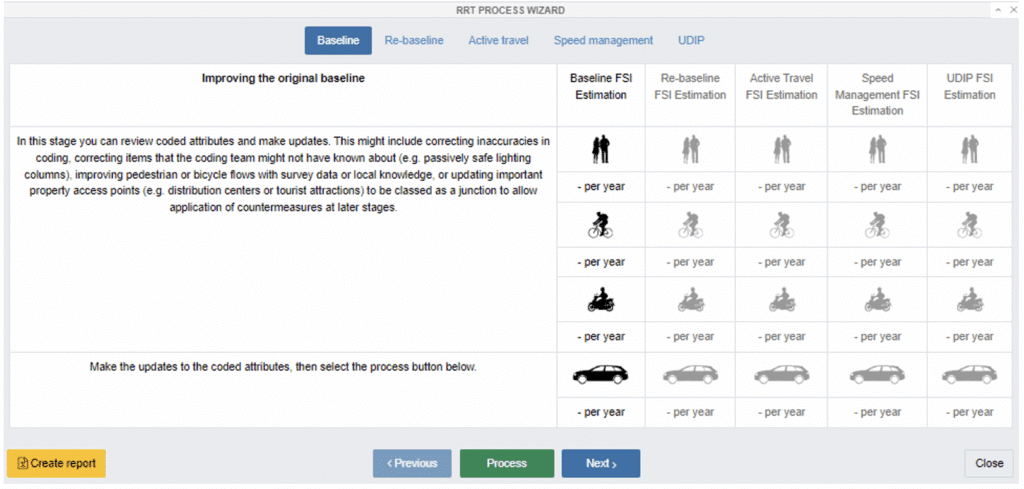
Figure 3: RRT process wizard
At each step the model returns the expected impact on FSIs, the revised Star Rating tables, revised Star Rating maps and revised speed and FSI estimation profiles. This means that each step can build on earlier steps, and impact of each treatment stage can be articulated.
This step includes:
- Reviewing coding to look for inaccuracies (here it is important that changes are made under the supervision of an iRAP accredited coder).
- Reviewing property access points and changing these to junctions if there is any likelihood that treatment could be desirable (since the iRAP model does not allow enhancements to property access points).
- Updating pedestrian and bicyclist peak hour flows to accord with local intelligence and knowledge (noting that walking and cycling surveys are rarely available).
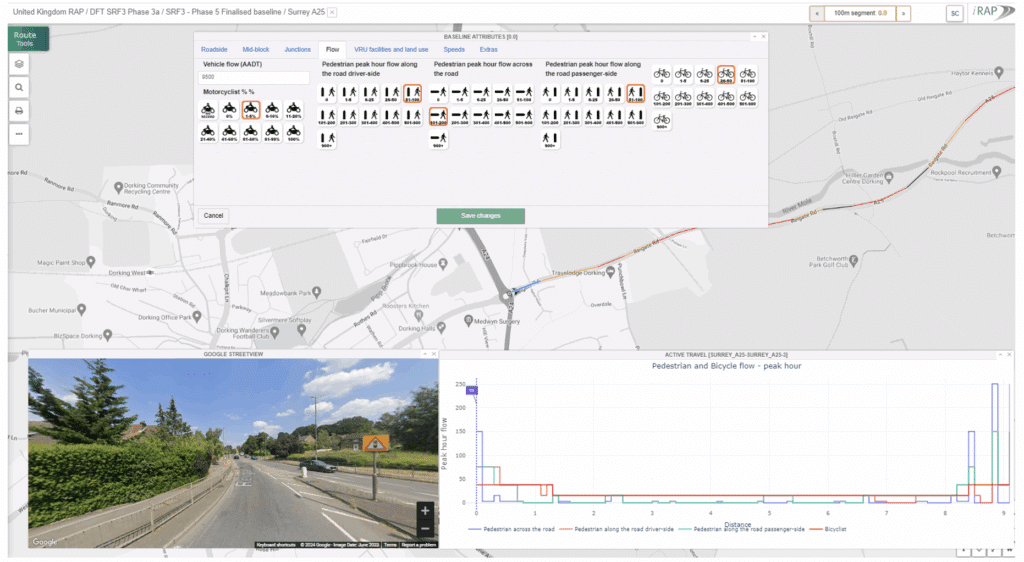
Figure 4: Interface for refining the baseline, re-baselining and active travel elevation
Any of the coded attributes can be amended at this stage to ensure the baseline is as good as it can be. The changes are re-processed through the iRAP model and the results are returned in the RRT.
The speed management functionality is the main change in the RRT since the last release. The new functionality aligns well to the Safe System as it presents a picture of how well the road engineering provision aligns to the operation of the road with respect to vehicle speeds that are so critical to survivability.
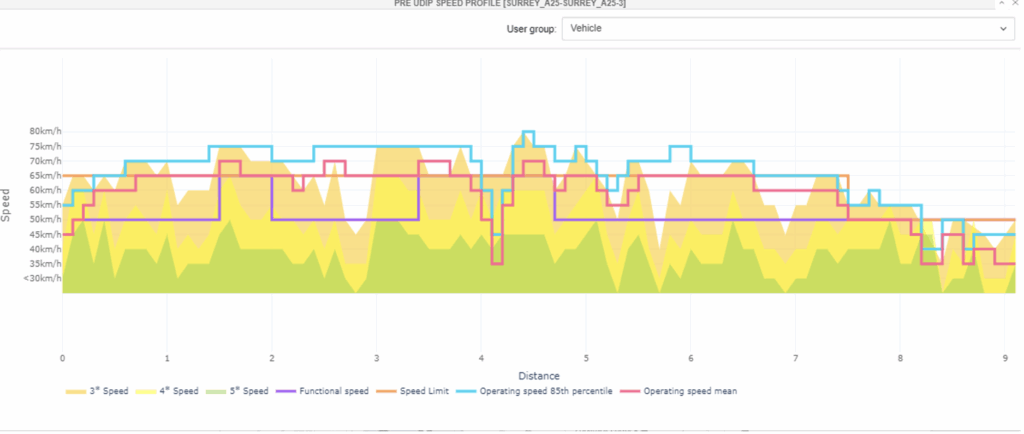
Figure 5: Detailed Speed Profile
The speed profile can be considered alongside the FSI estimate profile and Star Ratings to really understand the performance of the route. Together they can be used to identify areas for concern and by crash type and user type.
Note that the speed profile pictured here is for vehicle occupants, but that these are available for motorcyclists, pedestrians and bicyclists as well.
The posted speed limit is shown in orange in the profile. This is hidden below the pink line for the most part in this particular profile. The 85th percentile [1] and mean speeds are shown in blue and pink respectively. These are included in recent United Kingdom iRAP surveys and derived from connected vehicle or telematics device data. Having this available every 100m provides a rich understanding of the route’s operation.
The final line is purple. This denotes a functional speed for the road, which reflects the speed that the road needs to operate to fulfil its role in the network hierarchy – which is determined by what kind of road it is and what users need to be supported on it. For example, if a road is a quiet country lane its primary role might be to support walking, cycling and horse-riding rather than through traffic movement, in which case you might set the functional speed lower than if the route’s role was to connect two vibrant towns. Not many road authorities have yet set functional classifications/hierarchies so consider this particular line illustrative only.
Behind the lines are shaded areas of green, yellow and orange which show the speed ranges that, if operated at those speeds, the route would achieve 5, 4 and 3 Stars respectively. If aiming for a Safe System, the speed at which 5 Stars would be achieved could be considered a proxy for a safe speed, however in many cases aiming for a ‘safer’ speed may be appropriate in which case a 3 or 4 Star speed may be the target.
The speed profile requires careful consideration before speed management measures can be considered and this is readily done alongside other information such as the FSI profile in the RRT.
22 speed management countermeasures are now included in the RRT. The speed management measures and their impact have been derived from a detailed literature review.
These speed measures will not be triggered by the iRAP model, but can be selected by practitioners to see the likely impact of these treatments on vehicle speeds, Star Ratings and FSI estimates. This means that these can be selected and then processed through the iRAP model to return information that can be used in a business case.
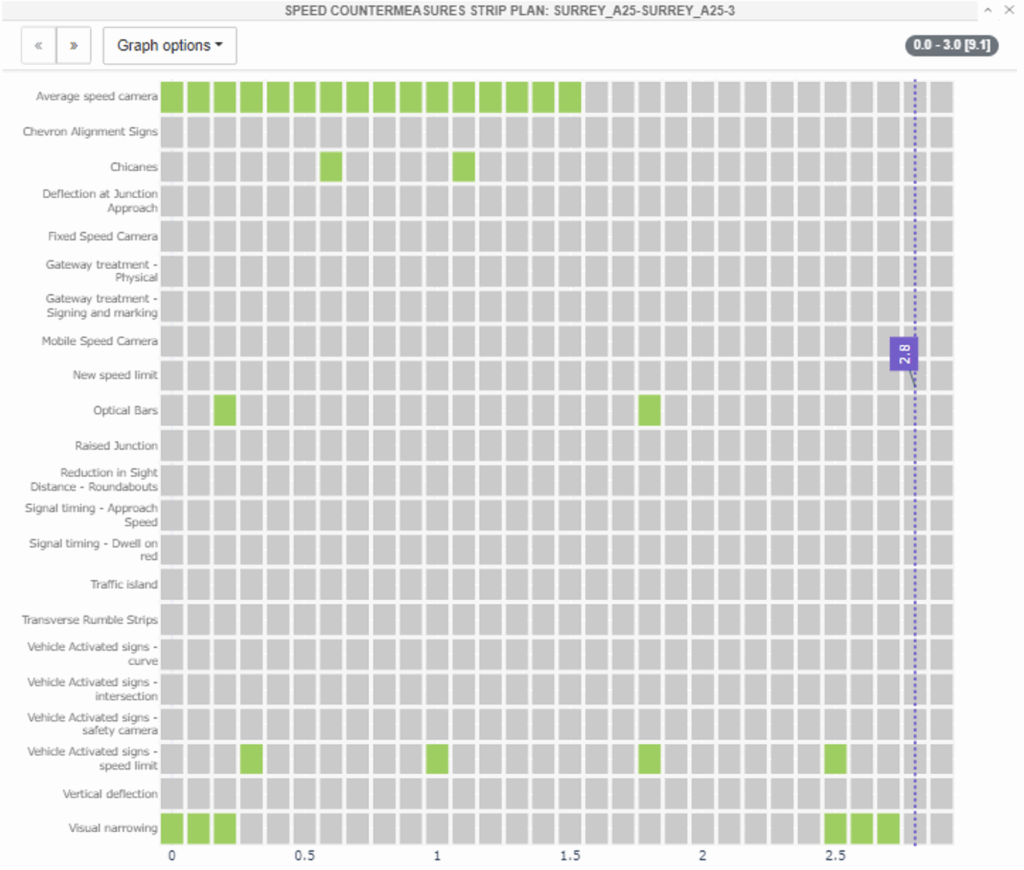
Figure 7: Speed management countermeasures and modelling interface (note: fictional speed management scenario)
UDIP
Here the practitioner can review the speed profile, the FSI profile, the image of the road, the Star Ratings and the countermeasures triggered by the iRAP model. The practitioner then determines the best set of treatments to take forward that takes account of budgetary constraints, local policy, conflicting priorities and environmental constraints. These can be modelled at the 100m level through the countermeasure tool or over a longer stretch using the STRIP plan. Road safety engineering measures that can be applied include median treatments to provide greater separation between opposing traffic, clearing or protecting roadsides, improving junctions, provision of facilities for walking and cycling. There are well over 100 road safety engineering measures available in the route review tool for application.
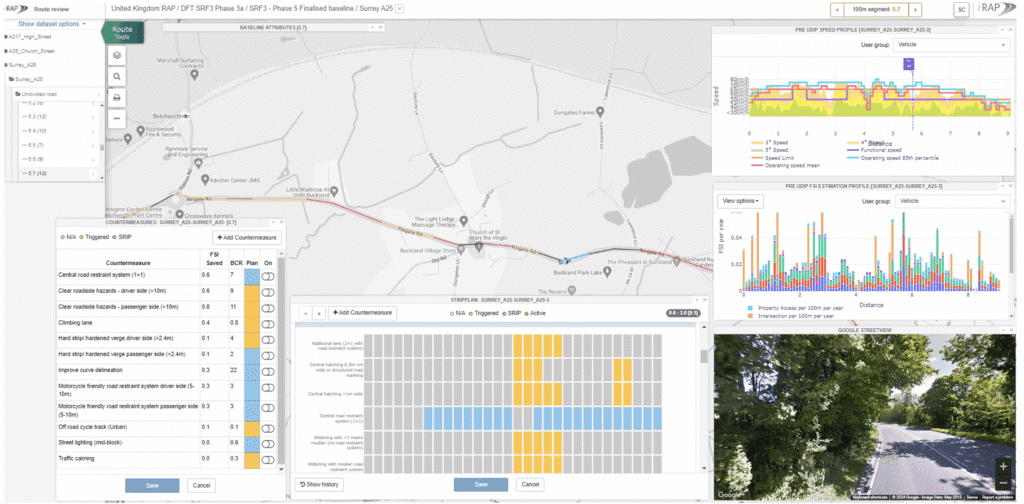
Figure 9: Interface for modelling the UDIP
[1] The 85th percentile speed is the speed at or below which 85 percent of the drivers travel on a road segment