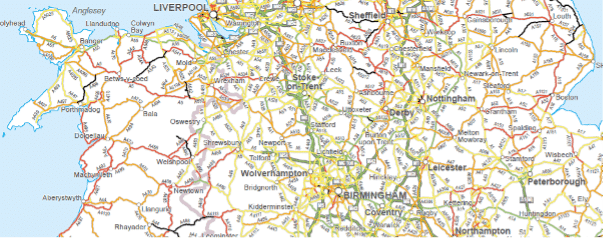
For more than 20 years, the Road Safety Foundation has published Crash Risk Mapping results and now provides a portal for people to access the results. The Crash Risk Mapping work is used to help articulate the overall business case for investment on Britain’s Motorways and A roads and to help identify which routes would be the best candidates for investment.
The Crash Risk Mapping provides colour-coded maps showing the level of risk for individual users on each route on Britain’s motorway and A road network. This network represents less than 15% of Britain’s total road length, but almost 60% of fatal road crashes – and more than 40% of serious road crashes – occur on these roads. The risk level for each route is classified into one of five bands both for crash density (crashes per kilometre road length) and for crash rate (crashes per vehicle-kilometre). Significantly improved routes are identified.

On routes with higher numbers of crashes, indicative benefit-cost ratios of potential road safety schemes are also calculated which can be used in outline cases for investment on roads.
